

When I started working with ARM microcontroles, I found myself lost among large amounts of information about how to program them, debug them and even about different ways to show logs. Information is not a problem when there’s a huge community base, the issue is to organize all this data, and this is specially difficult for newcomers. In this post I’m going to try to explain what I’ve learned about ARM debugging (in particular Cortex-M) without going deep into the details.
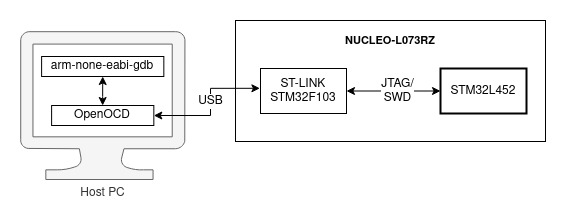
The diagram below represents they key tools we will need: a hardware probe with a JTAG/SWD interface, and a couple of software pieces on our host PC. The ultimate goal is to communicate our PC with another microcontroller.
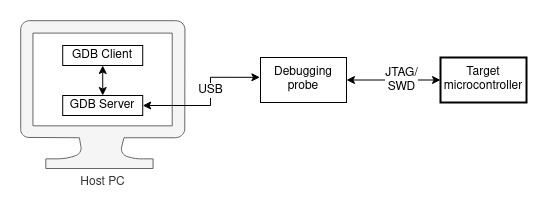
Programming and debugging system
Interfaces
When starting a project, the most common way to make sure everything works fine (the hello world), is to print some messages through the UART. The only thing we need to read that from the host computer is a serial to USB converter (usually known as FTDI, which is actually the name of the biggest manufacturer of these ICs). This is relatively simple to set up and it’s very cheap (a converter costs 2-3€).
Despite being a very convenient approach, using the serial port usually falls short of our needs. The biggest disadvantage is that printing through UART interferes with the execution of the code, which means that our code can behave differently with and without logs. Another important con is that we will need to reserve one UART for this purpose and typically not use it for anything else. Finally, the serial to USB converter can only be used to send/receive data, but if we were to use the proper tools, we could do a full debugging of our target processor, including step by step execution, adding breakpoints or memory and registers inspection.
Now that we know that UART is not what we should be using, what can we replace it with? The answer is (for Cortex-M micros), one of the following interfaces:
- JTAG: this is the classical interface, it was designed in the 90 and it needs 4 signal pins (plus power and some times a target reset).
- SWD: Serial Wire Debug is broadly used nowadays. It’s pretty much a reduced version of the JTAG that requires just 2 signal pins (SWD and SWCLK) and optionally a third one (SWO) to send and receive data. It’s also possible to send and receive packets without using SWO thanks to libraries like Segger RTT, but this is not standard and it needs a Segger probe like the ones you will find in the next section.
Flashing and debugging probes
There are many different devices, each of them in a different price range, that implement the aforementioned interfaces. The most important ones are:
- Segger J-Link Debug Probe: probaly the most extended one among professionals due to its reliability. They offer different models with different features and price ranges, starting at 300€. They also have many tools that generally are very stable and multi-platform.
- ST-LINK: this device is very well-known due to its low-cost clones (less than 5€). It’s compatible with most of the ST Microelectronics micros like the STM32.
- Black Magic Probe (BMP): an open source software and hardware alternative.
- ARM ULINK: manufactured by ARM itself. There are different models. I haven’t used them so I can’t say much about them.
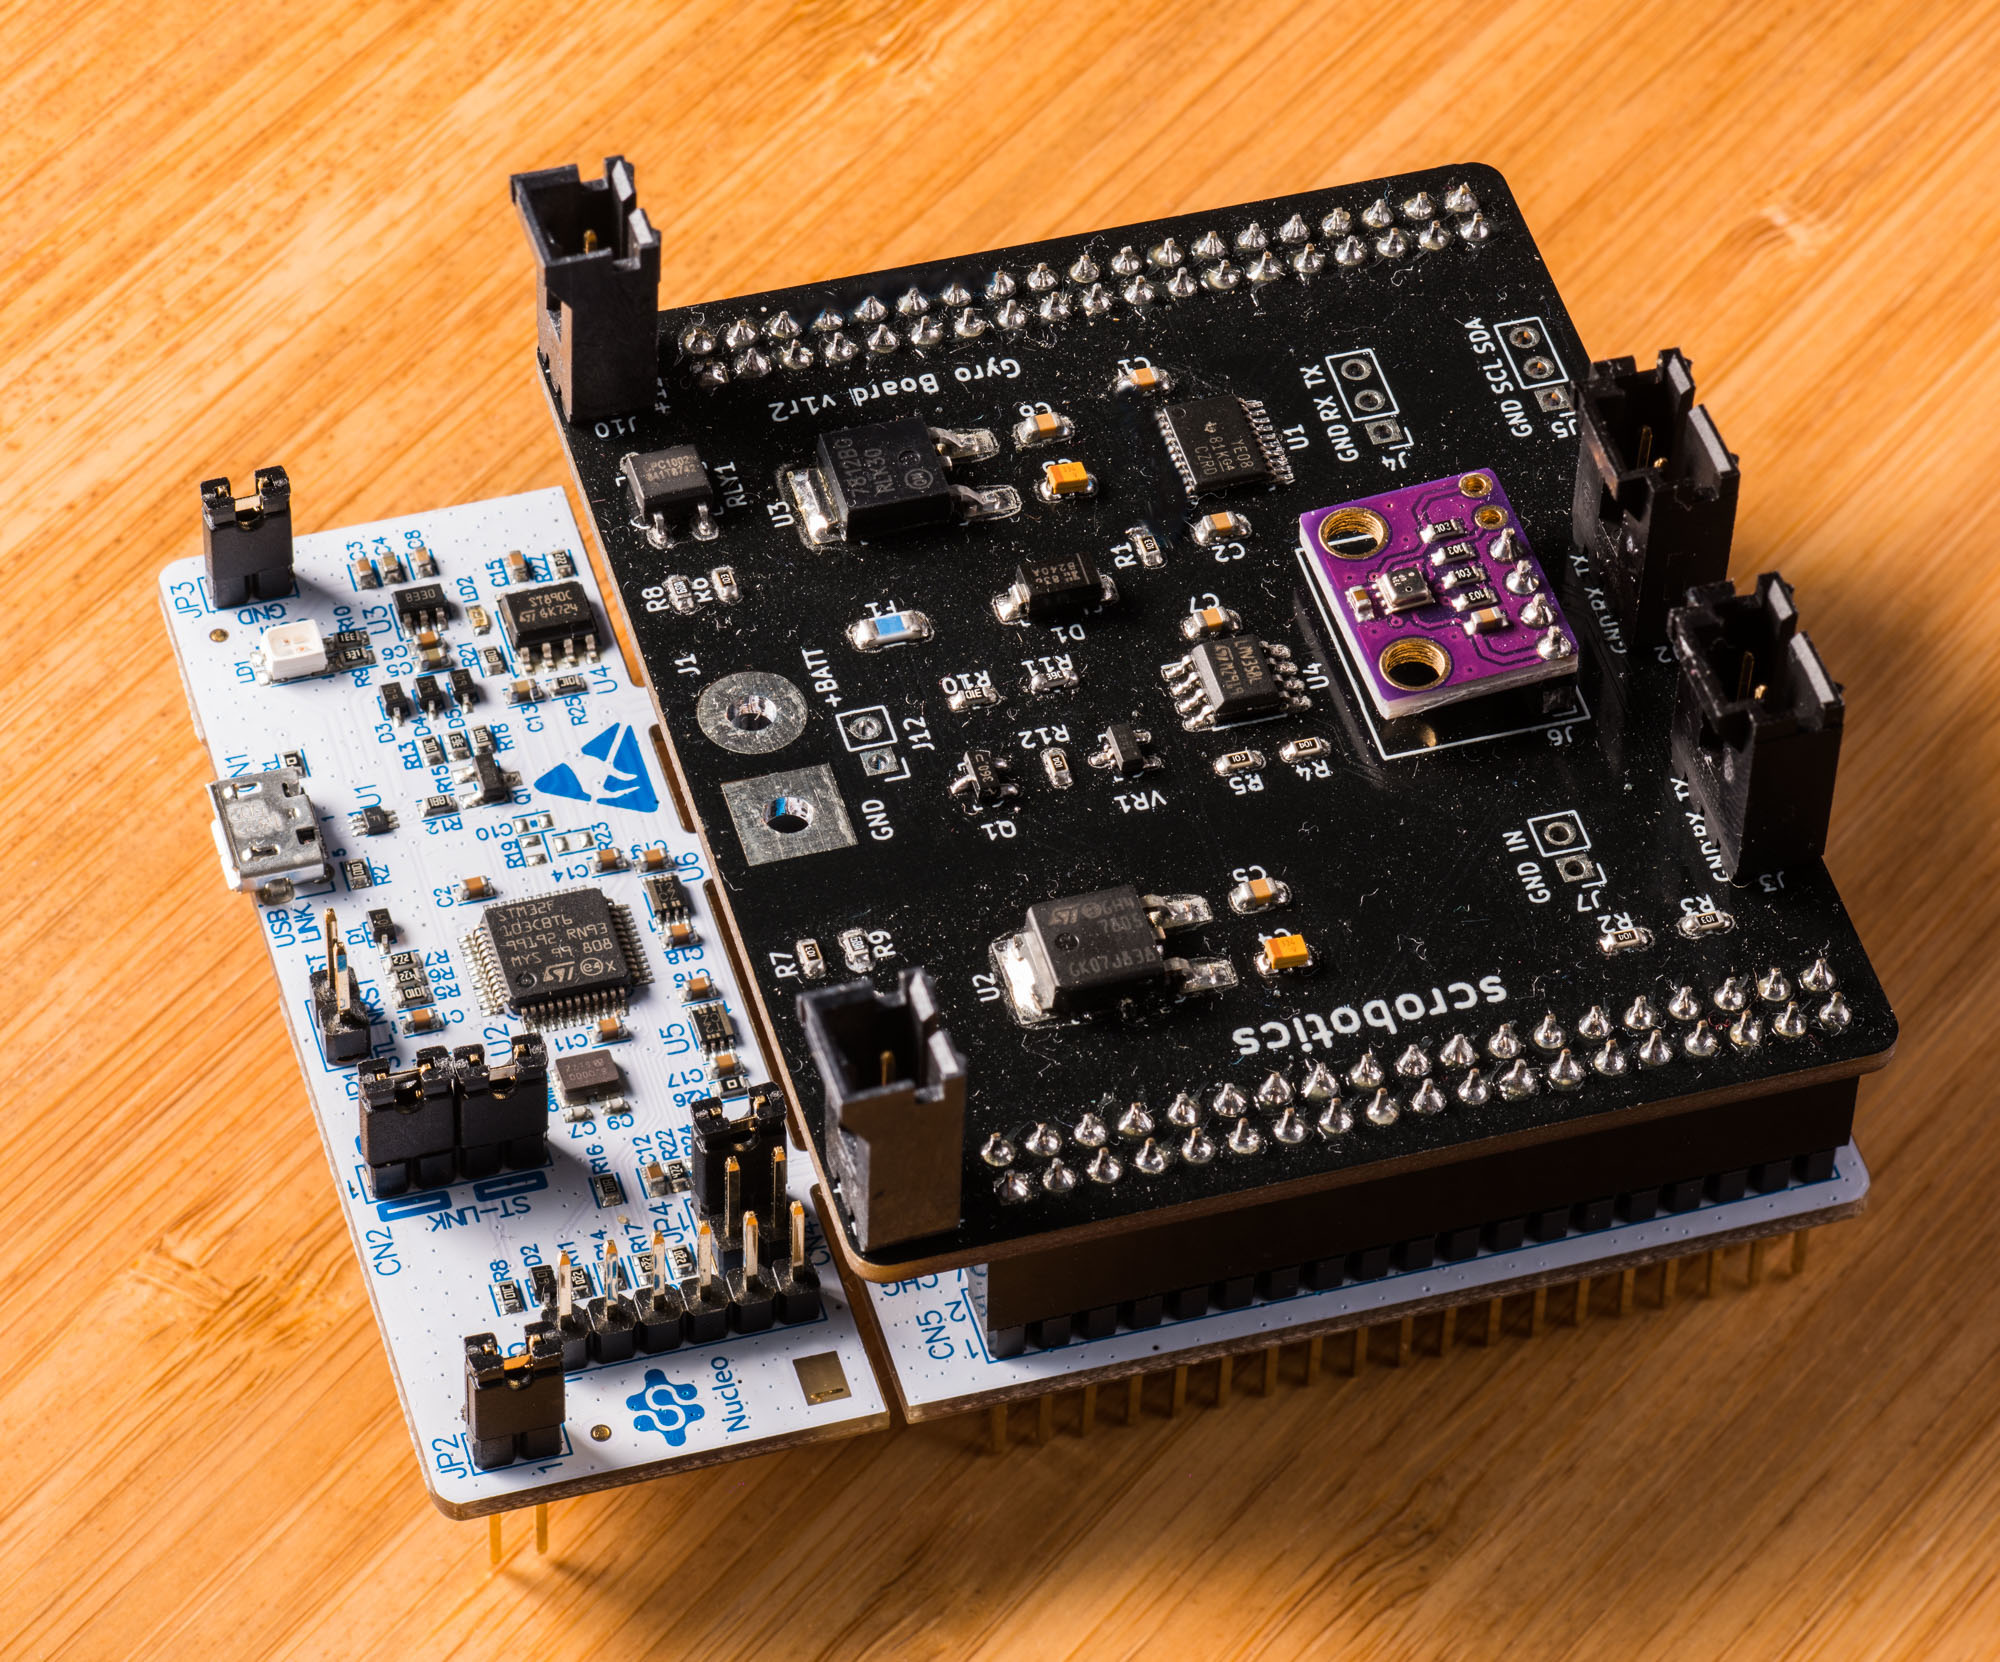
All these probes are physical devices which connect to the target microcontroller and the host computer (in particular the GDB server). In most of the cases we can also find the firmware of these devices (or a simpler version) available to use with other hardware. That’s what we will usually find in the development kits. If we pay attention, we will find at least two micros on those boards, the one we will be using and flashing, and the one that will act as the development probe.
Programming and debugging a development kit
- OpenSDA: firmware used in the NXP development kits. The latest versions are open source. Segger has also a version to make these boards compatible with their tools.
- J-Link OB: Segger firmware that can turn many microcontrollers into a J-Link LITE probe.
- Arm Mbed DAPLink: open-source software project that enables programming and debugging application software running on Arm Cortex CPUs.
- The firmware of the BMP can also be flashed on other devices like the ST-LINK or the Bluepills.
GDB Servers
On the host computer (the PC we use for development), we have to start a piece of software called the GDB server, which will communicate the probe with the GDB client (see next section).
- OpenOCD: it’s open source and I haven’t encountered issues when ussing it, however I find this project chaotic because they don’t do releases and it’s difficult to distinguish what’s stable from what’s not. On the bright side, it supports a wide range of devices and probes.
- Segger J-Link GDB Server: compatible with Segger probes.
- pyOCD: tool to flash and debug Cortex-M microcontrollers. It supports DAPLink probes and the latest versions of ST-LINK probes.
- stlink: open source tool compatible with the ST-LINK probes.
GDB Clients
The GDB debugging clients can have a graphical user interface (for instance many development IDEs) or they can be accessed through command line using arm-none-eabi-gdb. I usually work with Visual Studio Code and cortex-debug pluging, but there are other alternatives such us Ozone from Segger or Eclipse with GNU MCU Eclipse extension.
Conclusions
I hope this blog post has been useful to understand the blocks that play a key role in a programming and debugging environment. As you may notice, if there’s an important player in this field, that’s Segger. I could have mentioned them in every paragraph. If you are into open source, there are also many tools that should be good enough in most of the scenarios.
Finally, I would like to emphasize again what I said at the beginning of the post: logs can only help us with the debugging when our problem is straightforward. As embedded software developers, we must be aware of the tools we can use to do our job the best and fastest we can.
More info
If you want to read more about this topic I recommend you to go through the following links:
- A post titled “A Deep Dive into ARM Cortex-M Debug Interfaces” and many other entries of the same blog
- The blog MCU on Eclipse
- The tutorials in GNU MCU Eclipse
- A link about semihosting, a way to debug targets that you may find in many places but I haven’t explained here